
HUL – SHOULD YOU BUY, SELL OR HOLD?
Following the recent correction, the valuation of Hindustan Unilever Limited (HUL) appears attractive, we recommend a Buy rating on the stock.
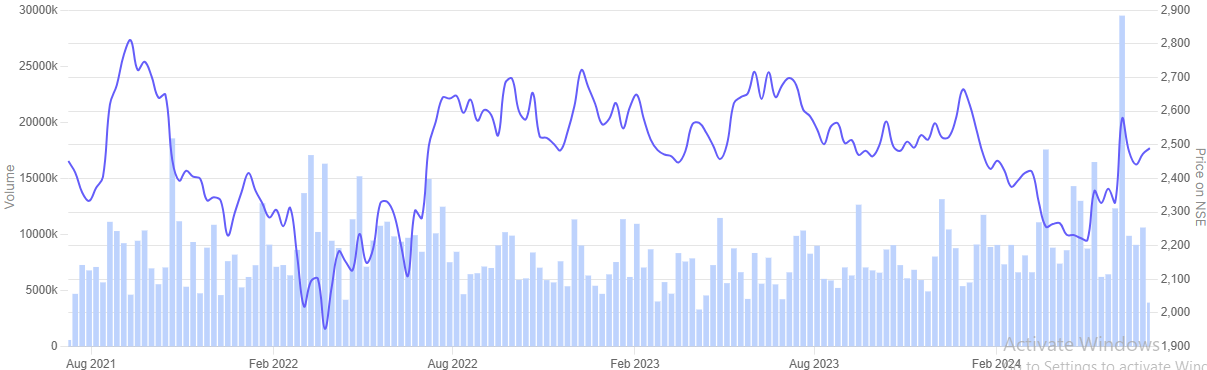
PRICE: 2603
BUY | Target 7,820 – 5 Years
VALUATIONS
| COMPANIES | MEDIAN PE | CURRENT PE |
| Nifty FMCG | 43.4 | 45.8 |
| HUL | 63.90 | 56.80 |
| ITC | 21.80 | 25.90 |
| Nestle | 79.60 | 63.00 |
| Varun Beverages | 60.40 | 98.00 |
| Britannia | 55.30 | 61.70 |
| Godrej Consumer Products Ltd | 50.60 | 73.70 |
| Dabur | 55.00 | 59.10 |
| Tata Consumer Products | 68.80 | 77.80 |
| Marico | 50.30 | 53.50 |
| Colgate Palmolive | 44.90 | 58.20 |
5 Year and 10 Year Median P/E of HUL is 64 and 61. Long Term Median P/E is 47.
Valuations are below HUL’s 10-year low P/E of about 56 at the moment.
HUL’s 3 Year Sales and PAT Growth is 10% and 8%, and Stock Price CAGR is -2%. Slow growth will continue for some time. Price CAGR will depend of P/E re-rating.
We believe any uptick in expected growth may trigger a rerating.
| FY24 | FY25 E | FY26 E | FY27 E | CAGR @3YR | |
| SALES | 61,896 | 67467 | 73879 | 80901 | 9% |
| PROFIT | 13,926 | 15179 | 16714 | 18404 | 10% |
| EPS in Rs | 44 | 48 | 52 | 58 | 10% |
| PE | 64 | ||||
| PRICE | 3699.4 | ||||
| CMP | 2502.40 | ||||
| Upside | 14% |
OUR CALL
BUY
HUL has an operating revenue of Rs. 61,896 Cr. in FY24. An annual revenue growth of 2.17% is not great, an Operating margin of 24% is great, ROE of 24% is exceptional. The company is debt-free and has a strong balance sheet enabling it to report stable earnings growth across business cycles. Recovery in rural demand, improvement in the consumption of mass product categories and sustenance of good growth in premium categories will help volume growth to recover in the quarters ahead. HUL has underperformed broader indices for last one year (corrected by 18% from a 52-week high).
Any consistent recovery in volume growth and margin expansion in the near term would act as a key trigger for valuations to improve going ahead.
Why is HUL’s share price declining?
|
COMPANIES |
MARKET CAP (IN CR) |
STOCK PRICE CAGR@3YR |
SALES |
|||
|
31-Mar-21 |
31-Mar-24 | CAGR@3YR | ||||
| Nifty FMCG | ₹ 24,37,197.00 | 15.5% | ||||
| HUL | ₹ 5,87,415.80 | -2.0% | 47028 | 61896 | 10% | |
| ITC | ₹ 5,30,413.00 | 25.0% | 49257 | 70881 | 13% | |
| Nestle | ₹ 2,47,403.00 | 14.6% | 14741 | 24349 | 18% | |
| Varun Beverages | ₹ 2,11,861.00 | 84.3% | 8823 | 16467 | 23% | |
| Britannia | ₹ 1,31,668.00 | 10.5% | 13136 | 16769 | 8% | |
| Godrej Consumer Products Ltd | ₹ 1,40,837.00 | 19.4% | 11029 | 14096 | 9% | |
| Dabur | ₹ 1,06,986.00 | -0.7% | 9562 | 12404 | 9% | |
| Tata Consumer Products | ₹ 1,04,807.00 | 20.0% | 11602 | 15206 | 9% | |
| Marico | ₹ 79,528.00 | 6.4% | 8048 | 9653 | 6% | |
| Colgate Palmolive | ₹ 77,869.00 | 20.3% | 4841 | 5680 | 5% | |
| COMPANIES | MARGINS | |||||
| 31-Mar-21 | 31-Mar-24 | |||||
| GPM | OPM | GPM | OPM | GPM EXPANSION | OPM EXPANSION | |
| Nifty FMCG | ||||||
| HUL | 52.6% | 24.5% | 52.3% | 23.68% | -0.3% | -1.2% |
| ITC | 57.2% | 34.0% | 63.3% | 37.0% | 6.0% | 3.0% |
| Nestle | 58.5% | 25.8% | 56.8% | 25.6% | -1.7% | -0.1% |
| Varun Beverages | 55.8% | 17.0% | 56.3% | 22.9% | 0.5% | 5.9% |
| Britannia | 40.5% | 16.1% | 44.9% | 19.3% | 4.4% | 3.1% |
| Godrej Consumer Products Ltd | 55.8% | 20.1% | 56.1% | 22.3% | 0.4% | 2.2% |
| Dabur | 48.7% | 18.9% | 48.6% | 16.6% | -0.1% | -2.3% |
| Tata Consumer Products | 39.2% | 9.8% | 46.1% | 16.0% | 6.9% | 6.2% |
| Marico | 44.1% | 15.9% | 51.6% | 19.4% | 7.4% | 3.6% |
| Colgate Palmolive | 67.7% | 32.9% | 69.3% | 35.7% | 1.6% | 2.9% |
Even if we compare on OPM basis the HUL margins of 23.68% lies the 4th best among its peers.
| COMPANIES | Cash Conversion Cycle (In Days) | ||
| 31-Mar-21 | 31-Mar-24 | ROCE | |
| Nifty FMCG | |||
| HUL | -83 | -70 | 27% |
| ITC | 129 | 146 | 38% |
| Nestle | -7 | -24 | 169% |
| Varun Beverages | 30 | 38 | 29% |
| Britannia | -3 | -9 | 49% |
| Godrej Consumer Products Ltd | 11 | 16 | 19% |
| Dabur | 3 | 0 | 22% |
| Tata Consumer Products | 61 | 25 | 11% |
| Marico | 17 | 22 | 43% |
| Colgate Palmolive | -91 | -113 | 97% |
