What does VIX really indicate is best understood with an Example
Let’s consider a recent example involving an Indian company to illustrate this concept of VIX more clearly. In April 2024, when Tata Consultancy Services (TCS) reported its Q4 FY24 earnings, the stock surged by over 4%. However, the value of its call options either fell or saw only modest gains. Under normal circumstances, a 4% rise in the stock price would have been expected to lead to a significant increase in the call option prices, potentially around 25-30%. This discrepancy occurred because of implied volatility. Historically, TCS’s stock had experienced substantial jumps of 6-10% immediately after earnings announcements, leading the market to price in a similar move this time as well. Consequently, option prices were already much higher before the results were declared in comparison to their theoretical values due to the high implied volatility factored into their pricing. Once the earnings results were released, the actual volatility levels dropped significantly, leading to an immediate decrease in option prices. This drop in volatility, despite the rise in the stock price, limited any potential gains in the call options.

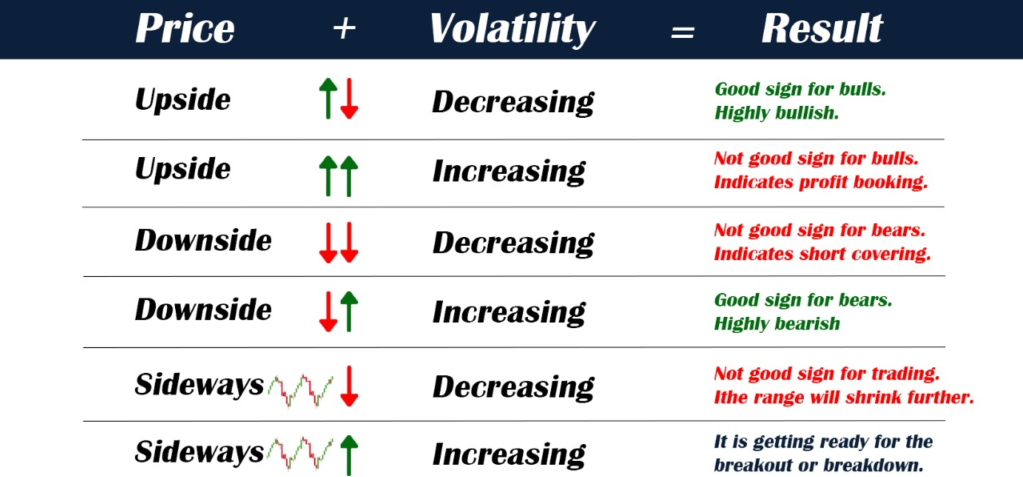
How to interpret VIX
Some Historical Perspective on VIX
The greatest trick the economists Fischer Black and Myron Scholes. Robert C. Merton pulled was to convince everyone that Black and Scholes model will be used to compute option prices of financial instruments.
To understand this Fancy term VIX it is essential to understand the reasoning behind creating the Black–Scholes model, Published in 1973, the Black-Scholes Option Pricing model brings a new quantitative approach to pricing options, helping fuel the growth of derivative investing. The true impact of this model was realized when it began to be used for calculating the Implied Volatility of options, represented by the σ term in the formula.
BLACK AND SCHOLES MODEL

Implied volatility is the rate of volatility that, when input into an option pricing model such as Black-Scholes, yields the current market price of the option. However, the primary application of the Black-Scholes model is to calculate the implied volatility of an instrument by inputting the current market price of the option. This allows investors to gauge the level of Volatility the market is attributing to that particular instrument.
Volatility measures the rate and magnitude of the change of prices (up or down) of the underlying. A high volatility rate means that prices of the underlying are expected to fluctuate widely while a low rate implies steadiness in the prices.
The fundamental difference between implied volatility and historical volatility is that implied volatility is a forward-looking metric, indicating the risk that the market is pricing in at any given moment. In contrast, historical volatility is derived from past price data, reflecting the actual fluctuations experienced by the instrument over a specific period.
Let me explain this further; if we use an option pricing model to find the theoretical price of an option we will often find that it is different from the prevailing market prices, the reason for this is a higher/lower volatility being expected by the market. This in essence is implied volatility; the rate of volatility that is implied by the price of an option in the market.
The India VIX typically remains below 30 points. However, during the COVID-19 crash, volatility spiked to 70.39 points, indicating significant uncertainty and fear among investors.
How is India VIX calculated?
To calculate the implied volatility aka VIX that is being assumed on average by the market for the entire index, We would analyze all the different options that are traded on the Nifty we can get a composite value by entering the best bid-ask prices of NIFTY Options contracts. This composite value is calculated daily and a collection of these values gives us the VIX index. Looking at the VIX index we can immediately decipher how much risk is being priced in by the market; this is why the VIX index is also commonly referred to as the fear-gauge of the market as it allows us to quantify the uncertainty, fear, or even complacency/greed prevailing in the market at any given point of time.