Our Take – Heidelberg Cement India
Key Focus: EBITDA/Tonne and Premium Positioning
Heidelberg Cement is strategically enhancing its EBITDA per tonne and reinforcing its premium market positioning. The company is actively de-bottlenecking its existing clinker capacity, which is anticipated to drive higher volume growth moving forward.
Positive Demand Outlook
The long-term cement demand outlook remains favorable, underpinned by:
- Increased government expenditure on infrastructure and affordable housing.
- Strong demand in the real estate sector.
This robust demand environment is expected to sustain Heidelberg Cement’s growth trajectory and market presence.
Strong Financials
Heidelberg has strong return ratios with healthy operating cash flow generation. It has a liquid balance sheet with net debt-free status due to repayment of debt. This in the absence of any major debt-led Capex, stable profitability and cash flows will help HCIL survive tough times. Heidelberg has strong dividend payout which results in a dividend yield of ~3.67%.
Negative Working Capital
Heidelberg Cement is the only company amongst its peers that operates under Negative working Capital. As of 30th June 2024, the company reported gross cash of Rs 626 Cr and net cash of Rs 488 Cr. The company remains net debt-free.
Valuations and Recommendations
Heidelberg Cement is currently trading at 10x FY25E EV/EBITDA and 8.2x FY26E EV/EBITDA and at 15x FY26E PE whereas currently, the company is trading at a EV/EBITDA multiple of 15x and PE 32 FY24. We recommend a BUY.
| PARTICULARS (INR/CR) | FY20 | FY21 | FY22 | FY23 | FY24 | FY25E | FY26E |
| Sales Volume (MT) | 4.7 | 4.5 | 4.8 | 4.4 | 4.8 | 5.00 | 5.20 |
| Gross realisation (INR/t) | 4,611 | 4,665 | 4,694 | 5,096 | 4,922 | 4,900 | 4,900 |
| Revenue (INR/CR) | 2,170 | 2,117 | 2,297 | 2,238 | 2,366 | 2,449.6 | 2,547.6 |
| Raw Material | 389 | 372 | 429 | 401 | 462 | 489.9 | 509.5 |
| Power & Fuel | 474 | 488 | 642 | 773 | 670 | 536.0 | 469.0 |
| Freight & Forwarding | 288 | 277 | 296 | 312 | 350 | 367.4 | 382.1 |
| Employee benefit expenses | 131 | 127 | 131 | 133 | 153 | 147.0 | 152.9 |
| Other Expenses | 361 | 345 | 365 | 371 | 415 | 440.9 | 458.6 |
| EBITDA | 527 | 508 | 434 | 248 | 316 | 468 | 576 |
| Enterprise Value (INR/CR) | 4740 | 4740 | |||||
| EV/EBITDA | 19 | 15 | 10.1 | 8.2 |
| PARTICULARS (INR/CR) | FY20 | FY21 | FY22 | FY23 | FY24 | FY25E | FY26E |
| Other income | 53 | 46 | 49 | 45 | 55 | 49.0 | 51.0 |
| Depreciation | 109 | 111 | 112 | 112 | 110 | 122.5 | 127.4 |
| EBIT | 471 | 443 | 371 | 181 | 261 | 395 | 499 |
| Interest & Fin Chg. | 74 | 51 | 36 | 46 | 35 | 24.5 | 25.5 |
| EBT | 397 | 392 | 335 | 135 | 226 | 370 | 474 |
| TAX | 130 | 76 | 83 | 37 | 59 | 111 | 142 |
| EAT | 267 | 316 | 252 | 98 | 167 | 259 | 332 |
| EPS | 11.8 | 13.9 | 11.1 | 4.4 | 7.4 | 11.5 | 14.7 |
| PE | 19 | 15 |
Financial Performance
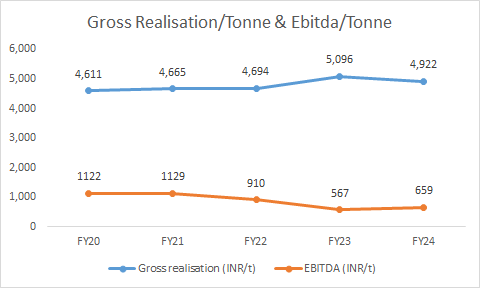
The company experienced a 9% increase in volume. However, we believe volume growth will be 4% going forward compared to 6% guided by the management. Revenue and EBITDA increased by 5.71% and 27.4% YoY, respectively, primarily due to decreased input costs such as power and fuel costs. The EBITDA margin came in at 13%, an increase of 18% YOY. Net profit stood at Rs 226 Cr up 67.4% YoY. EBITDA per tonne increased by 16.3% YoY to Rs 659/Tonne. Blended realization per tonne was Rs 4922, a reduction of 3.4% YoY.
Key Metrics
| Particulars | FY20 | FY21 | FY22 | FY23 | FY24 |
| Revenue (INR/CR) | 2,170 | 2,117 | 2,297 | 2,238 | 2,366 |
| Overall Capacity (MT) | 6.26 | 6.26 | 6.26 | 6.26 | 6.26 |
| Sales Volume (MT) | 4.7 | 4.5 | 4.8 | 4.4 | 4.8 |
| Gross realisation (INR/t) | 4,611 | 4,665 | 4,694 | 5,096 | 4,922 |
| EBITDA (INR/t) | 1122 | 1129 | 910 | 567 | 659 |
| Capacity Utilization | 87% | 72% | 76% | 70% | 77% |
| EBITDA (INR/CR) | 581 | 553 | 484 | 249 | 317 |
| EBITDA Margin(%) | 24% | 24% | 19% | 11% | 13% |
| Net Profit (INR/CR) | 268 | 315 | 252 | 99 | 168 |
| Green power % of total power | 22% | 22% | 23% | 33% | 38% |
Key Growth Triggers
Over the years, Heidelberg has resorted to various cost-cutting measures and optimization of its facilities. Some major ones are highlighted below-
- Heidelberg has targeted to reach >40% green power by FY25, which implies a reduction of ~30-35% in power and fuel cost.
- Heidelberg Cement currently derives 92% of its revenue from the central region, capturing approximately 8% of the market there. The remaining 8% of revenue comes from the southern region. The company is actively seeking to expand its presence in Gujarat, aiming to diversify its regional footprint and capture new growth opportunities.
- Continuously increasing premiumization and optimizing toward the appropriate mix-
-
Premium Cement Product:
- The company has launched a new value-added product called Power Shield.
- It is priced INR 50 to INR 60 higher per bag compared to regular products.
- The company reported 82% trade sales which results in 10-15 Rs higher realisation compared to Non-Trade
-
- Will continue to operate on negative net operating working capital.
- Heidelberg Cement’s current capacity utilization stands at 77% for FY24, down from 91% in FY19, indicating substantial headroom for growth. The company anticipates higher volume growth, reflecting strong potential demand and capacity to scale up operations.
- Limestone is the primary raw material for manufacturing cement – The company installed an enormous 21 Km long overland conveyor belt system to transport limestone from its mines in Patheria (M.P.) to its clinker facility at Narsingh, Damoh. This not only helps in reducing transportation costs but also loading/unloading times.
- Having mining access to limestone reserves, especially near the plants, is perhaps the biggest competitive advantage. Though Heidelberg does have mining rights (in Patheria Mines, near Damoh, M.P.) but procuring new access to limestone reserves may pose a challenge when the company decides to move to newer geographies.
- Cement is a low-value and high-volume commodity and as such freight costs are significant. As per company’s annual report 2017-18, Heidelberg has one of the lowest freight costs in the industry. This has been achieved by adopting a flexible and dynamic mix of rail-road at 56%-44% for FY24. The company has also entered into some long-term tariff agreements with Indian Railways.
About the stock
Heidelberg Cement is a mid-sized (6.3 MT) player operating mainly in the central region. Its cement plants are located at Damoh (MP), Jhansi (UP) and Ammasandra (Karnataka).
- The company sells cement under Mycem and Mycem Power brand
Segment
The company is in the production of 100% blended cement.
Capacity utilisation
The cement grinding capacity of the company is currently at 75% The company added 1.05MTPA capacity in FY20 but the same was completely utilised due to volume growth in FY21. Company has a CO2 footprint of 504 Kg/t cement. The total capacity of the company is 30mn tonnes
CAPEX
The company is debottlenecking its clinker capacity at its MP plant with a capital cost of Rs 70 Cr, aimed at increasing clinker capacity by 2 Lc tonnes annually. This facility is expected to become operational in Q1FY25.
Key Risks
- Lower realization and demand in its key market and delay in capacity expansion.
- Higher input costs may impact margins.
- Competition: The capacity expansion, coupled with a fragmented market, could lead to increased competition and potentially put pressure on cement prices.
- Global Headwinds: The global slowdown and geopolitical tensions pose risks to India’s export growth and foreign investments.
