‘ITC is, at its core, a tobacco company. End of story. Period.’ You can sugarcoat it all you want, but that’s the reality.
Now that the hotel demerger is done, investors have partially gotten what they wanted. They may not be happy with ITC retaining a 40% stake, but they’ll have to take that with a pinch of salt. Naturally, I did what most would—assessing how much value ITC has truly unlocked post-demerger.
After thorough research and considering all angles, I’ve arrived at a fair value of ₹390. Could I be wrong? Absolutely. But that’s the beauty of markets—you just need to be less wrong than others. Would I short it? No. As Charlie Munger said, ‘Never underestimate someone who overestimates himself,’ and ITC’s FMCG ambitions feel like an overestimation. If you’re after ~10-12% returns (including dividend yield), buy at ₹400. Otherwise, there are better opportunities elsewhere.
Here’s my approach to value ITC: I’ve used a Sum-of-the-Parts (SOTP) DCF model to arrive at a fair value. While my analysis relies heavily on assumptions, I’ve made every effort to stay grounded and balanced in those assumptions. I neither champion nor criticize ITC—my views remain entirely neutral.
VALUE OF EQUITY (As Per My Estimates)
( ₹ IN CRORES)
| The Cash Flows | |||||||
| Revenues | Operating Margin | EBIT | EBIT (1-t) | Reinvestment | FCFF | ROIC | |
| 1 | ₹ 83,519.70 | 32.82% | ₹ 27,409.72 | ₹ 20,557.29 | ₹ 2,358.38 | ₹ 18,198.91 | 36.1% |
| 2 | ₹ 91,462.21 | 32.70% | ₹ 29,906.09 | ₹ 22,429.57 | ₹ 2,662.96 | ₹ 19,766.61 | 37.8% |
| 3 | ₹ 1,00,357.00 | 32.24% | ₹ 32,356.58 | ₹ 24,267.43 | ₹ 3,011.46 | ₹ 21,255.97 | 39.1% |
| 4 | ₹ 1,10,337.38 | 31.75% | ₹ 35,028.24 | ₹ 26,271.18 | ₹ 3,410.65 | ₹ 22,860.53 | 40.4% |
| 5 | ₹ 1,21,557.11 | 31.28% | ₹ 38,029.12 | ₹ 28,521.84 | ₹ 3,334.06 | ₹ 25,187.77 | 41.7% |
| 6 | ₹ 1,32,288.58 | 30.90% | ₹ 40,878.44 | ₹ 30,658.83 | ₹ 3,160.76 | ₹ 27,498.08 | 42.7% |
| 7 | ₹ 1,42,108.08 | 30.59% | ₹ 43,477.93 | ₹ 32,608.45 | ₹ 2,812.77 | ₹ 29,795.68 | 43.5% |
| 8 | ₹ 1,50,576.14 | 30.37% | ₹ 45,723.23 | ₹ 34,292.42 | ₹ 2,326.56 | ₹ 31,965.86 | 44.1% |
| 9 | ₹ 1,57,270.07 | 30.21% | ₹ 47,510.16 | ₹ 35,632.62 | ₹ 1,716.19 | ₹ 33,916.44 | 44.5% |
| 10 | ₹ 1,61,820.59 | 30.12% | ₹ 48,742.49 | ₹ 36,556.87 | ₹ 1,798.63 | ₹ 34,758.24 | 44.7% |
| Terminal year | ₹ 1,66,607.28 | 30% | ₹ 49,405.80 | ₹ 37,054.35 | ₹ 3,620.84 | ₹ 33,433.51 | 44.3% |
| The Value | ||||||
| Terminal value | ₹ 5,73,878.39 | |||||
| PV(Terminal value) | ₹ 2,71,124.67 | |||||
| PV (CF over next 10 years) | ₹ 1,77,020.44 | |||||
| Value of operating assets = | ₹ 4,48,145.11 | |||||
| – Debt & Minority Interests | ₹ 830.50 | |||||
| + Cash & Other Non-operating assets* | ₹ 47,217.25 | |||||
| Value of equity | ₹ 4,94,531.86 | |||||
| – Value of equity options | ₹ 1,291.69 | |||||
| Number of shares | ₹ 1,266.67 | |||||
| Value per share | ₹ 389.40 | Stock was trading at = | ₹ 436.00 | |||
*I have accounted for ITC Hotels under Cash & Other Non-Operating Assets, valuing it at 40% of its market cap as of 30-01-2025.
| COST OF CAPITAL | ||||
| RFR = 4.60% (10 Yr Bond Yield – Country Default Spread) = 6.770% – 2.18% | ||||
| Equity Risk Premium = 7.26% | ||||
| Beta (Industry Avg) | ||||
| FMCG-Cigg | 0.24 | |||
| FMCG-Others | 0.75 | |||
| Agri | 0.61 | |||
| Paper and Packaging | 0.38 | |||
| ITC Others | 0.77 | |||
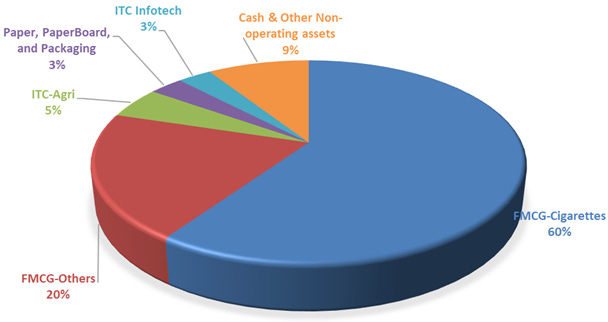
So, moving on to the first part of the 5-part SOTP “FMCG CIGARETTES— The Sinful Driver Powering ITC’s Engine”
Much of the debate around ITC centers on its cigarette business. To put things in perspective, ITC holds approximately 73% market share in the legal cigarette market. But here’s the bummer — the legal cigarettes market accounts for just 9% of overall tobacco consumption. This share has fallen from 21% in 1981-82 to 9% in 2017-18 due to rising taxes. High taxes and extreme tobacco control regulations have fueled the growth of illicit manufacturing and trade across the country.
Given the government’s limited success in curbing illicit trade, I believe this issue will persist, with a considerable portion of trade shifting toward illegal consumption. For this reason, I have assigned a conservative growth rate of just 5% for the cigarette business. Why not negative? Even if volumes decline, ITC still holds pricing power and can raise prices in the near to mid-term.
To reflect the long-term decline in cigarette consumption, I’ve assumed a -1% terminal growth rate for the segment. Yet, despite this, 59% of ITC’s total valuation still comes from the cigarette business.
That perfectly explains the title of my article and the message I want to convey—no matter how much ITC diversifies, at its core, it remains a tobacco company.
| The Assumptions | ||||||
| Base year | Next year | Years 2-5 | Years 6-10 | After year 10 | ||
| Revenues (a) | ₹ 34,704.18 | 5.0% | 5.00% | Changes to | -1.00% | Revenues are inclusive of excise duty |
| Operating margin (b) | 59.42% | 59.4% | Moves to | 59.42% | 59.42% | |
| Tax rate | 25.00% | 25.00% | Changes to | 25.00% | ||
| Sales to Capital (c ) | 7.67 | 7.67 | 7.67 | -0.29% | ||
| Return on Capital | 341.99% | Marginal ROIC = | 413.73% | 341.99% | ||
| Cost of capital (d) | 6.34% | 6.34% | ||||
| The Cash Flows | ||||||
| Revenues | Operating Margin | EBIT | EBIT (1-t) | Reinvestment | FCFF | |
| 1 | ₹ 36,439 | 59% | ₹ 21,653 | ₹ 16,239 | ₹ 237 | ₹ 16,002 |
| 2 | ₹ 38,261 | 59% | ₹ 22,735 | ₹ 17,051 | ₹ 249 | ₹ 16,802 |
| 3 | ₹ 40,174 | 59% | ₹ 23,872 | ₹ 17,904 | ₹ 262 | ₹ 17,642 |
| 4 | ₹ 42,183 | 59% | ₹ 25,066 | ₹ 18,799 | ₹ 275 | ₹ 18,524 |
| 5 | ₹ 44,292 | 59% | ₹ 26,319 | ₹ 19,739 | ₹ 219 | ₹ 19,520 |
| 6 | ₹ 45,975 | 59% | ₹ 27,319 | ₹ 20,489 | ₹ 156 | ₹ 20,333 |
| 7 | ₹ 47,171 | 59% | ₹ 28,029 | ₹ 21,022 | ₹ 86 | ₹ 20,936 |
| 8 | ₹ 47,831 | 59% | ₹ 28,422 | ₹ 21,316 | ₹ 12 | ₹ 21,304 |
| 9 | ₹ 47,927 | 59% | ₹ 28,478 | ₹ 21,359 | -₹ 62 | ₹ 21,421 |
| 10 | ₹ 47,448 | 59% | ₹ 28,194 | ₹ 21,145 | -₹ 62 | ₹ 21,207 |
| Terminal year | ₹ 46,973 | 59% | ₹ 27,912 | ₹ 20,934 | ₹ 0 | ₹ 20,934 |
| The Value | ||||||
| Terminal value | ₹ 2,85,202 | |||||
| PV(Terminal value) | ₹ 1,54,236 | |||||
| PV (CF over next 10 years) | ₹ 1,37,911 | |||||
| Value of operating assets = | ₹ 2,92,147 | |||||
Now comes The Big Bet—FMCG (Others)
Credit where it’s due—ITC has done a tremendous job with its FMCG (Others) segment, growing from nothing to a major player in just two decades. In contrast, giants like HUL and Nestlé took over a century to reach their current scale.
Much of the debate revolves around whether ITC deserves similar valuations, but purely by the numbers, there’s no like-to-like comparison. Since most of ITC’s FMCG growth has been organic, and assuming no major acquisitions, I believe it will take another decade for ITC to match HUL’s revenue. Margin-wise, ITC will likely prioritize penetration over profitability and the list goes on for keeping margins low to drive sustainable growth and increase consumer adoption.
| The Assumptions | ||||||
| Base year | Next year | Years 2-5 | Years 6-10 | After year 10 | ||
| Revenues (a) | ₹ 21,610.28 | 11.8% | 15.00% | Changes to | 4.60% | |
| Operating margin (b) | 8.50% | 10.0% | Moves to | 15.00% | 20.00% | |
| Tax rate | 25.00% | 25.00% | Changes to | 25.00% | ||
| Sales to Capital (c ) | 3.00 | 3.00 | 3.00 | 15.33% | ||
| Return on Capital | 11.02% | Marginal ROIC = | 57.58% | 30.00% | ||
| Cost of capital (d) | 10.00% | 8.93% | ||||
| The Cash Flows | ||||||
| Revenues | Operating Margin | EBIT | EBIT (1-t) | Reinvestment | FCFF | |
| 1 | ₹ 24,152.47 | 10.00% | ₹ 2,415.25 | ₹ 1,811.44 | ₹ 1,207.62 | ₹ 603.81 |
| 2 | ₹ 27,775.34 | 12.00% | ₹ 3,333.04 | ₹ 2,499.78 | ₹ 1,388.77 | ₹ 1,111.01 |
| 3 | ₹ 31,941.64 | 13.00% | ₹ 4,152.41 | ₹ 3,114.31 | ₹ 1,597.08 | ₹ 1,517.23 |
| 4 | ₹ 36,732.89 | 14.00% | ₹ 5,142.60 | ₹ 3,856.95 | ₹ 1,836.64 | ₹ 2,020.31 |
| 5 | ₹ 42,242.83 | 15.00% | ₹ 6,336.42 | ₹ 4,752.32 | ₹ 1,819.26 | ₹ 2,933.06 |
| 6 | ₹ 47,700.60 | 16.00% | ₹ 7,632.10 | ₹ 5,724.07 | ₹ 1,723.58 | ₹ 4,000.49 |
| 7 | ₹ 52,871.34 | 17.00% | ₹ 8,988.13 | ₹ 6,741.10 | ₹ 1,543.84 | ₹ 5,197.25 |
| 8 | ₹ 57,502.87 | 18.00% | ₹ 10,350.52 | ₹ 7,762.89 | ₹ 1,280.40 | ₹ 6,482.49 |
| 9 | ₹ 61,344.06 | 19.00% | ₹ 11,655.37 | ₹ 8,741.53 | ₹ 940.61 | ₹ 7,800.92 |
| 10 | ₹ 64,165.89 | 20.00% | ₹ 12,833.18 | ₹ 9,624.88 | ₹ 983.88 | ₹ 8,641.01 |
| Terminal year | ₹ 67,117.52 | 20.00% | ₹ 13,423.50 | ₹ 10,067.63 | ₹ 1,543.70 | ₹ 8,523.93 |
| The Value | ||||||
| Terminal value | ₹ 1,96,857.40 | |||||
| PV(Terminal value) | ₹ 78,152.67 | |||||
| PV (CF over next 10 years) | ₹ 20,617.10 | |||||
| Value of operating assets = | ₹ 98,769.77 | |||||
I have assumed a 15% CAGR for ITC’s FMCG segment over the next five years, which I believe is reasonable given the current economic conditions. Of course, I could be wrong—things might change if private consumption picks up and government efforts successfully boost rural demand to match urban levels. Even in a best-case scenario, where FMCG revenue grows at a 20% CAGR for the next five years, my valuation only increases to ₹409. This doesn’t significantly impact my overall valuation, so I chose to stick with my original assumptions.
Then come the three segments that may not grab headlines but are often considered the backbone of ITC’s diversification—Agri-Business, Paperboards & Specialty Papers (including Packaging), and Infotech.
Since I don’t have much insight into how these businesses will evolve beyond the synergies already reflected in FMCG-Cigarettes and FMCG Others’ margins, I’ll admit I don’t have a strong long-term view. So, at the risk of being wrong, I’ve valued these segments based on historical performance, keeping margins in line with past trends. Below are my workings.
Agri-Business
| The Assumptions | ||||||
| Base year | Next year | Years 2-5 | Years 6-10 | After year 10 | ||
| Revenues (a) | ₹10,999.02 | 8.0% | 10.00% | Changes to | 4.60% | |
| Operating margin (b) | 12.35% | 12.0% | Moves to | 12.00% | 12.00% | |
| Tax rate | 25.00% | 25.00% | Changes to | 25.00% | ||
| Sales to Capital (c ) | 3.00 | 3.00 | 3.00 | 27.74% | ||
| Return on Capital | 16.58% | Marginal ROIC = | 25.88% | 16.58% | ||
| Cost of capital (d) | 9.00% | 8.93% | ||||
| The Cash Flows | ||||||
| Revenues | Operating Margin | EBIT | EBIT (1-t) | Reinvestment | FCFF | |
| 1 | ₹ 11,879 | 12.00% | ₹ 1,425 | ₹ 1,069 | ₹ 396 | ₹ 673 |
| 2 | ₹ 13,067 | 12.00% | ₹ 1,568 | ₹ 1,176 | ₹ 436 | ₹ 740 |
| 3 | ₹ 14,374 | 12.00% | ₹ 1,725 | ₹ 1,294 | ₹ 479 | ₹ 814 |
| 4 | ₹ 15,811 | 12.00% | ₹ 1,897 | ₹ 1,423 | ₹ 527 | ₹ 896 |
| 5 | ₹ 17,392 | 12.00% | ₹ 2,087 | ₹ 1,565 | ₹ 517 | ₹ 1,048 |
| 6 | ₹ 18,943 | 12.00% | ₹ 2,273 | ₹ 1,705 | ₹ 495 | ₹ 1,210 |
| 7 | ₹ 20,428 | 12.00% | ₹ 2,451 | ₹ 1,839 | ₹ 460 | ₹ 1,378 |
| 8 | ₹ 21,809 | 12.00% | ₹ 2,617 | ₹ 1,963 | ₹ 413 | ₹ 1,550 |
| 9 | ₹ 23,048 | 12.00% | ₹ 2,766 | ₹ 2,074 | ₹ 353 | ₹ 1,721 |
| 10 | ₹ 24,108 | 12.00% | ₹ 2,893 | ₹ 2,170 | ₹ 370 | ₹ 1,800 |
| Terminal year | ₹ 25,217 | 12.00% | ₹ 3,026 | ₹ 2,270 | ₹ 630 | ₹ 1,640 |
| The Value | ||||||
| Terminal value | ₹ 37,876 | |||||
| PV(Terminal value) | ₹ 16,030 | |||||
| PV (CF over next 10 years) | ₹ 6,995 | |||||
| Value of operating assets = | ₹ 23,025 | |||||
Paperboards & Specialty Papers (including Packaging)
| The Assumptions | ||||||
| Base year | Next year | Years 2-5 | Years 6-10 | After year 10 | ||
| Revenues (a) | ₹ 6,181.35 | 12.0% | 7.00% | Changes to | 4.60% | |
| Operating margin (b) | 17.43% | 17.4% | Moves to | 20.00% | 20.00% | |
| Tax rate | 25.00% | 25.00% | Changes to | 25.00% | ||
| Sales to Capital (c ) | 2.00 | 2.00 | 2.00 | 51.51% | ||
| Return on capital | 9.43% | Marginal ROIC = | 35.38% | 8.93% | ||
| Cost of capital (d) | 7.50% | 8.93% | ||||
| The Cash Flows | ||||||
| Revenues | Operating Margin | EBIT | EBIT (1-t) | Reinvestment | FCFF | |
| 1 | ₹ 6,923 | 17% | ₹ 1,207 | ₹ 905 | ₹ 242 | ₹ 663 |
| 2 | ₹ 7,408 | 19% | ₹ 1,418 | ₹ 1,064 | ₹ 259 | ₹ 804 |
| 3 | ₹ 7,926 | 20% | ₹ 1,585 | ₹ 1,189 | ₹ 277 | ₹ 912 |
| 4 | ₹ 8,481 | 20% | ₹ 1,696 | ₹ 1,272 | ₹ 297 | ₹ 975 |
| 5 | ₹ 9,075 | 20% | ₹ 1,815 | ₹ 1,361 | ₹ 296 | ₹ 1,065 |
| 6 | ₹ 9,666 | 20% | ₹ 1,933 | ₹ 1,450 | ₹ 292 | ₹ 1,158 |
| 7 | ₹ 10,250 | 20% | ₹ 2,050 | ₹ 1,538 | ₹ 285 | ₹ 1,253 |
| 8 | ₹ 10,820 | 20% | ₹ 2,164 | ₹ 1,623 | ₹ 275 | ₹ 1,348 |
| 9 | ₹ 11,370 | 20% | ₹ 2,274 | ₹ 1,705 | ₹ 262 | ₹ 1,444 |
| 10 | ₹ 11,893 | 20% | ₹ 2,379 | ₹ 1,784 | ₹ 274 | ₹ 1,510 |
| Terminal year | ₹ 12,440 | 20% | ₹ 2,488 | ₹ 1,866 | ₹ 961 | ₹ 905 |
| The Value | ||||||
| Terminal value | ₹ 20,896 | |||||
| PV(Terminal value) | ₹ 9,744 | |||||
| PV (CF over next 10 years) | ₹ 7,198 | |||||
| Value of operating assets = | ₹ 16,942 | |||||
ITC OTHERS
| The Assumptions | ||||||
| Base year | Next year | Years 2-5 | Years 6-10 | After year 10 | ||
| Revenues (a) | ₹ 3,868.15 | 6.7% | 20.00% | Changes to | 4.60% | |
| Operating margin (b) | 17.20% | 17.2% | Moves to | 17.20% | 17.20% | |
| Tax rate | 25.00% | 25.00% | Changes to | 25.00% | ||
| Sales to Capital (c ) | 3.00 | 3.00 | 2.80 | 25.37% | ||
| Return on Capital | 18.13% | Marginal ROIC = | 36.12% | 18.13% | ||
| Cost of capital (d) | 10.19% | 8.93% | ||||
| The Cash Flows | ||||||
| Revenues | Operating Margin | EBIT | EBIT (1-t) | Reinvestment | FCFF | |
| 1 | ₹ 4,126 | 17% | ₹ 710 | ₹ 532 | ₹ 275 | ₹ 257 |
| 2 | ₹ 4,951 | 17% | ₹ 852 | ₹ 639 | ₹ 330 | ₹ 309 |
| 3 | ₹ 5,941 | 17% | ₹ 1,022 | ₹ 767 | ₹ 396 | ₹ 371 |
| 4 | ₹ 7,129 | 17% | ₹ 1,227 | ₹ 920 | ₹ 475 | ₹ 445 |
| 5 | ₹ 8,555 | 17% | ₹ 1,472 | ₹ 1,104 | ₹ 483 | ₹ 621 |
| 6 | ₹ 10,003 | 17% | ₹ 1,721 | ₹ 1,291 | ₹ 494 | ₹ 796 |
| 7 | ₹ 11,387 | 17% | ₹ 1,959 | ₹ 1,469 | ₹ 438 | ₹ 1,032 |
| 8 | ₹ 12,612 | 17% | ₹ 2,170 | ₹ 1,627 | ₹ 346 | ₹ 1,281 |
| 9 | ₹ 13,581 | 17% | ₹ 2,337 | ₹ 1,752 | ₹ 223 | ₹ 1,529 |
| 10 | ₹ 14,206 | 17% | ₹ 2,444 | ₹ 1,833 | ₹ 233 | ₹ 1,600 |
| Terminal year | ₹ 14,859 | 17% | ₹ 2,556 | ₹ 1,917 | ₹ 486 | ₹ 1,431 |
| The Value | ||||||
| Terminal value | ₹ 33,047 | |||||
| PV(Terminal value) | ₹ 12,962 | |||||
| PV (CF over next 10 years) | ₹ 4,300 | |||||
| Value of operating assets = | ₹ 17,262 | |||||
At the end of the day, ITC’s core remains unchanged—cigarettes fund its expansion, while FMCG carries its hopes for the future. Whether this transition succeeds is a debate for another day, but for now, the stock offers steady returns with limited upside. If you’re comfortable with that, ITC might be worth a look. If not, better opportunities exist elsewhere.