Investment Thesis
Gala is a business construct we’ve seen converge across geographies: small-value, high-criticality components; long approval cycles; customers structurally unable to be price-sensitive; revenue that behaves like an annuity once designed in. Gala runs a milder, more contested version of that template than the aerospace-grade purists – but it pairs it with a visible capacity S-curve and a de-levered balance sheet.
Snapshot
| Metric | Today | Metric | Today |
| CMP / Market Cap | ₹1178 / ₹1,510 Cr | FY26 Revenue | ₹314.3 Cr (+32% YoY) |
| 52-Week High / Low | ₹1191 / ₹648 | FY26 PAT | ₹35.5 Cr (+32% YoY) |
| Fall from ATH ₹1,480 | ~44% | FY26 EBITDA Margin | ~16% (Q4 17.9%) |
| P/E (TTM) | ~41.5x | FY26 EPS | ₹27.90 (basic) |
| P/B | ~5.15x | SFS segment (FY26) | ₹108 Cr (+64% YoY) |
| Listed | Sept 2024 (IPO) | FY27 Revenue guidance | +20-25% |
| Promoter Holding | ~63% (incl. R. Gogri) | FY27 Margin guidance | 17-19% |
| Net Worth / BVPS | ₹292 Cr / ₹213 | Net Debt | Low; short-term debt ₹35 Cr |
Start with the Buyer, Not the Seller
Here is the entire industry structure of high-grade precision components in one thought experiment. You run a wind turbine OEM. A disc spring or a wedge-lock washer inside your yaw or braking assembly costs you a rounding error – well under 1% of the machine’s bill of materials. If it fails, the failure costs you a turbine standing idle 100 metres in the air, a crane mobilisation, warranty claims, and a reputation problem with the utility that bought fifty of them.
Now ask the Porter question honestly: what is your bargaining power as this customer? On paper, enormous – you’re a giant buying from a small-cap. In practice, close to zero on price, because the component is too small to matter, and close to zero on switching, because re-qualifying a new supplier for a mission-critical part means months of testing, field validation and internal sign-offs. The customer can never be quality-agnostic or compliance-agnostic. So they do the rational thing: pay a fair-to-premium price and never think about the supplier again.
One Honest Calibration Up Front
Gala is not the extreme version of this template. It does not sit in aerospace-grade, sole-supplier, 40-month-qualification territory where a vendor becomes a de facto monopoly inside the customer. Gala’s domains – industrial springs and high-tensile fasteners for wind, rail, mobility, off-highway and electrical – are less stringent, with more credible competitors, including large European incumbents. The thesis is the same shape, at lower voltage: real switching costs, real approval cycles, but a moat measured in years of stickiness, not decades of exclusivity.
What Gala actually is
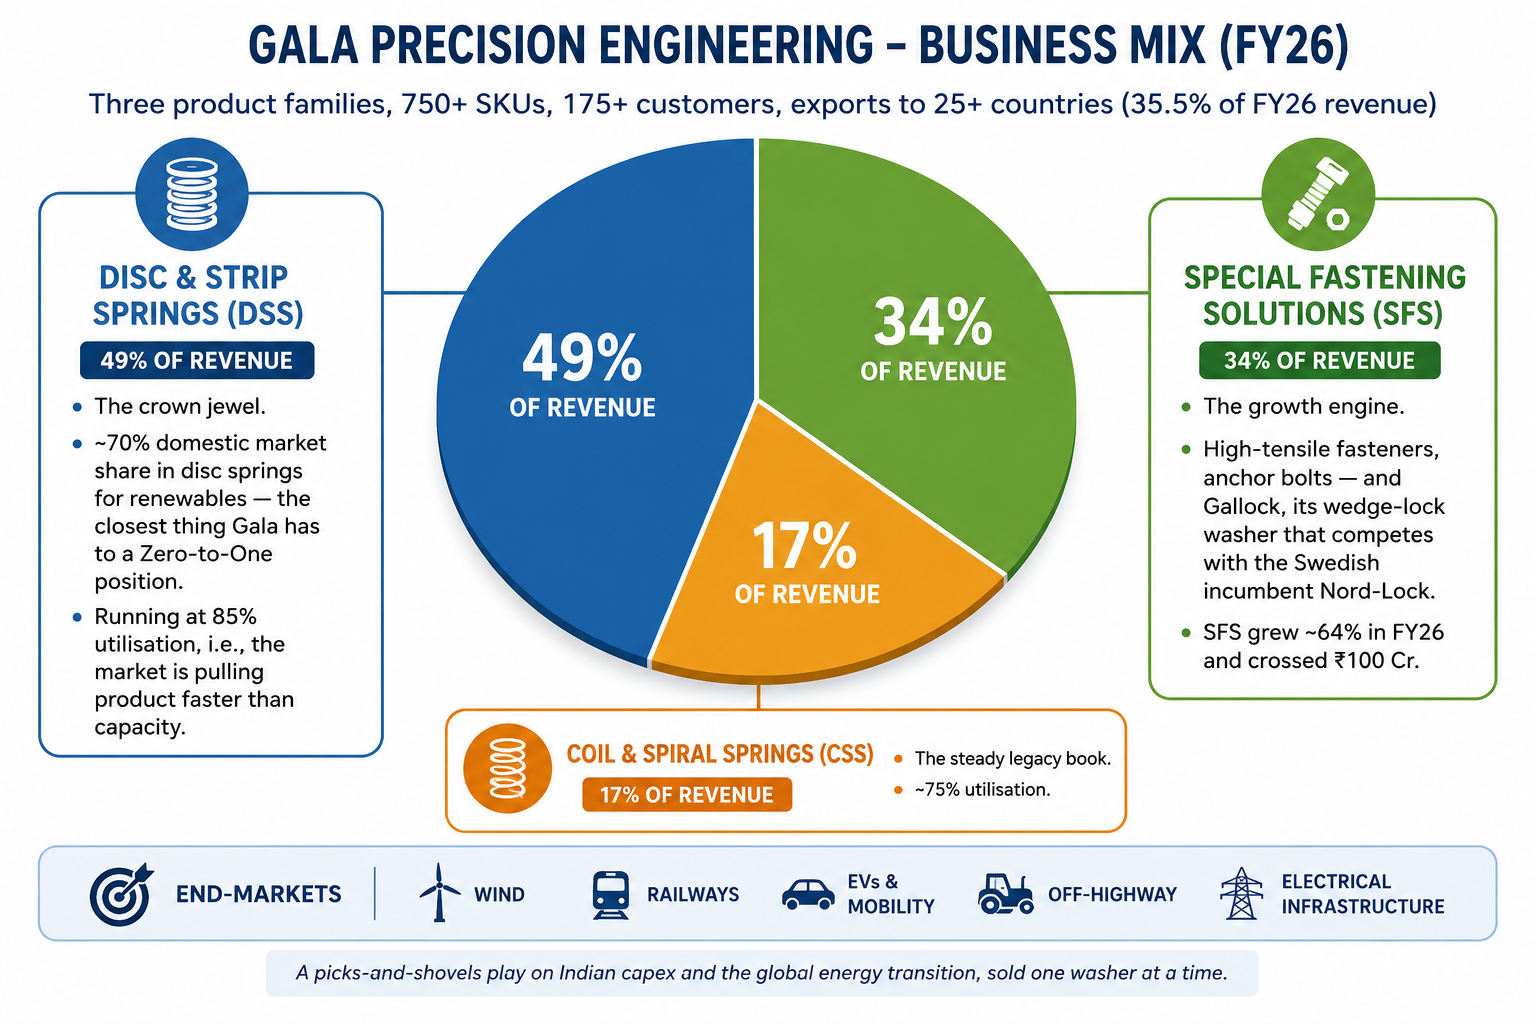
Three product families, 750+ SKUs, 175+ customers, exports to 25+ countries (35.5% of FY26 revenue):
Disc & Strip Springs (DSS), 49% of revenue. The crown jewel. ~70% domestic market share in disc springs for renewables . Running at 85% utilisation, i.e., the market is pulling product faster than capacity.
Special Fastening Solutions (SFS), 34% of revenue. The growth engine. High-tensile fasteners, anchor bolts – and Gallock, its wedge-lock washer that competes with the Swedish incumbent Nord-Lock. SFS grew ~64% in FY26 and crossed ₹100 Cr.
Coil & Spiral Springs (CSS), 17% of revenue. The steady legacy book, ~75% utilisation.
End-markets skew toward structural tailwinds: wind (where every megawatt of new capacity is embedded demand for Gala’s springs), railways, EVs, off-highway, electrical infrastructure. This is not a cyclical auto-ancillary in disguise; it’s a picks-and-shovels play on Indian capex and the global energy transition, sold one washer at a time.
The numbers: narrative meets audit
| FY (₹ Cr, consol.) | FY22 | FY23 | FY24 | FY25 | FY26 |
|---|---|---|---|---|---|
| Revenue | 145 | 165 | 203 | 238 | 314 |
| EBITDA margin | 14% | 17% | 19% | 17% | 16.5% |
| PAT | 7 | 24 | 22 | 27 | 35.5 |
| ROCE | 15% | 18% | 23% | 17% | ~17% |
| CFO | 12 | 16 | 16 | 3 | 10 |
| Borrowings | 57 | 60 | 57 | 24 | 38 |
Revenue has compounded ~21% over four years, FY26 grew 32% with PAT up 32% to ₹35.5 Cr, and the September 2024 IPO (₹121 Cr) retired most debt – the company is near net-cash with interest coverage above 9x. FY26 margin of 16.5% carried a ~₹3.2 Cr forex loss; Q4 printed 17.6%, back inside management’s 17-19% band. Zero pledged shares, promoters at ~55%.
Growth drivers: what fills the next three years
1. The Chennai fastener plant – the visible S-curve. A new 4,600 MTPA facility ran at ~35–40% utilisation in FY26, exiting at a ₹5 Cr monthly run-rate. Management targets ₹9-10 Cr per month by Q4 FY27, with Phase-2 capex completing around July 2026 and taking full-scale annual capacity toward ₹120 Cr. That single plant, ramped, is worth ~35% of FY26’s entire revenue. Machines take 3–4 months to install; the land and building already exist – the gestation risk is mostly behind, execution risk remains.
2. Gallock – the optionality with a lawsuit attached. A domestic challenger product to Nord-Lock’s wedge-lock washers, already approved with several customers. The signal worth noticing: Nord-Lock has filed a patent-infringement suit against Gala. Incumbents do not sue irrelevant competitors. It is simultaneously the best third-party validation of the product and the thesis’s binary risk – no provision has been made, and an adverse ruling could impair the SKU. Treat it as a real option with a non-trivial strike.
3. DSS at 85% utilisation + renewables capex. With 70% domestic share and wind installations accelerating, DSS growth is largely a capacity question, funded by remaining IPO proceeds (~₹37 Cr of ₹121 Cr still deployable as of March 2026).
4. Guidance. Management guides 20-25% revenue growth for FY27 with 17-19% EBITDA margins – implying roughly ₹380-395 Cr revenue and, at the mid-band, PAT in the mid-₹40 Cr range.
