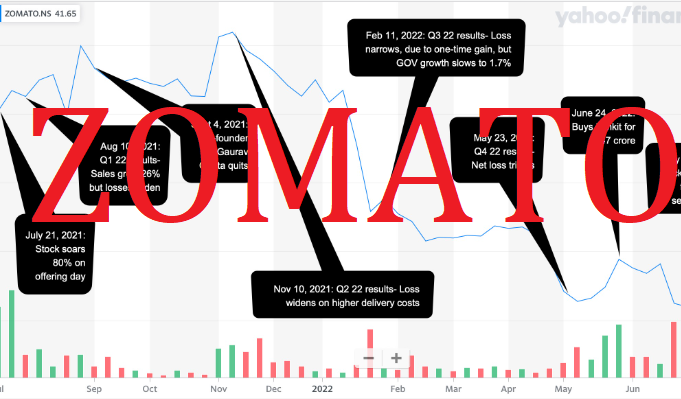
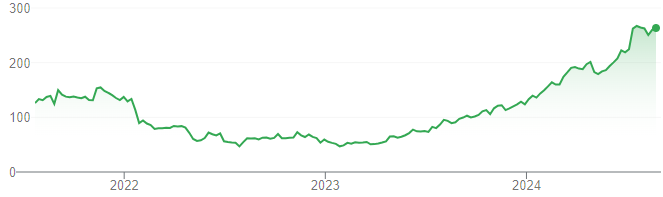
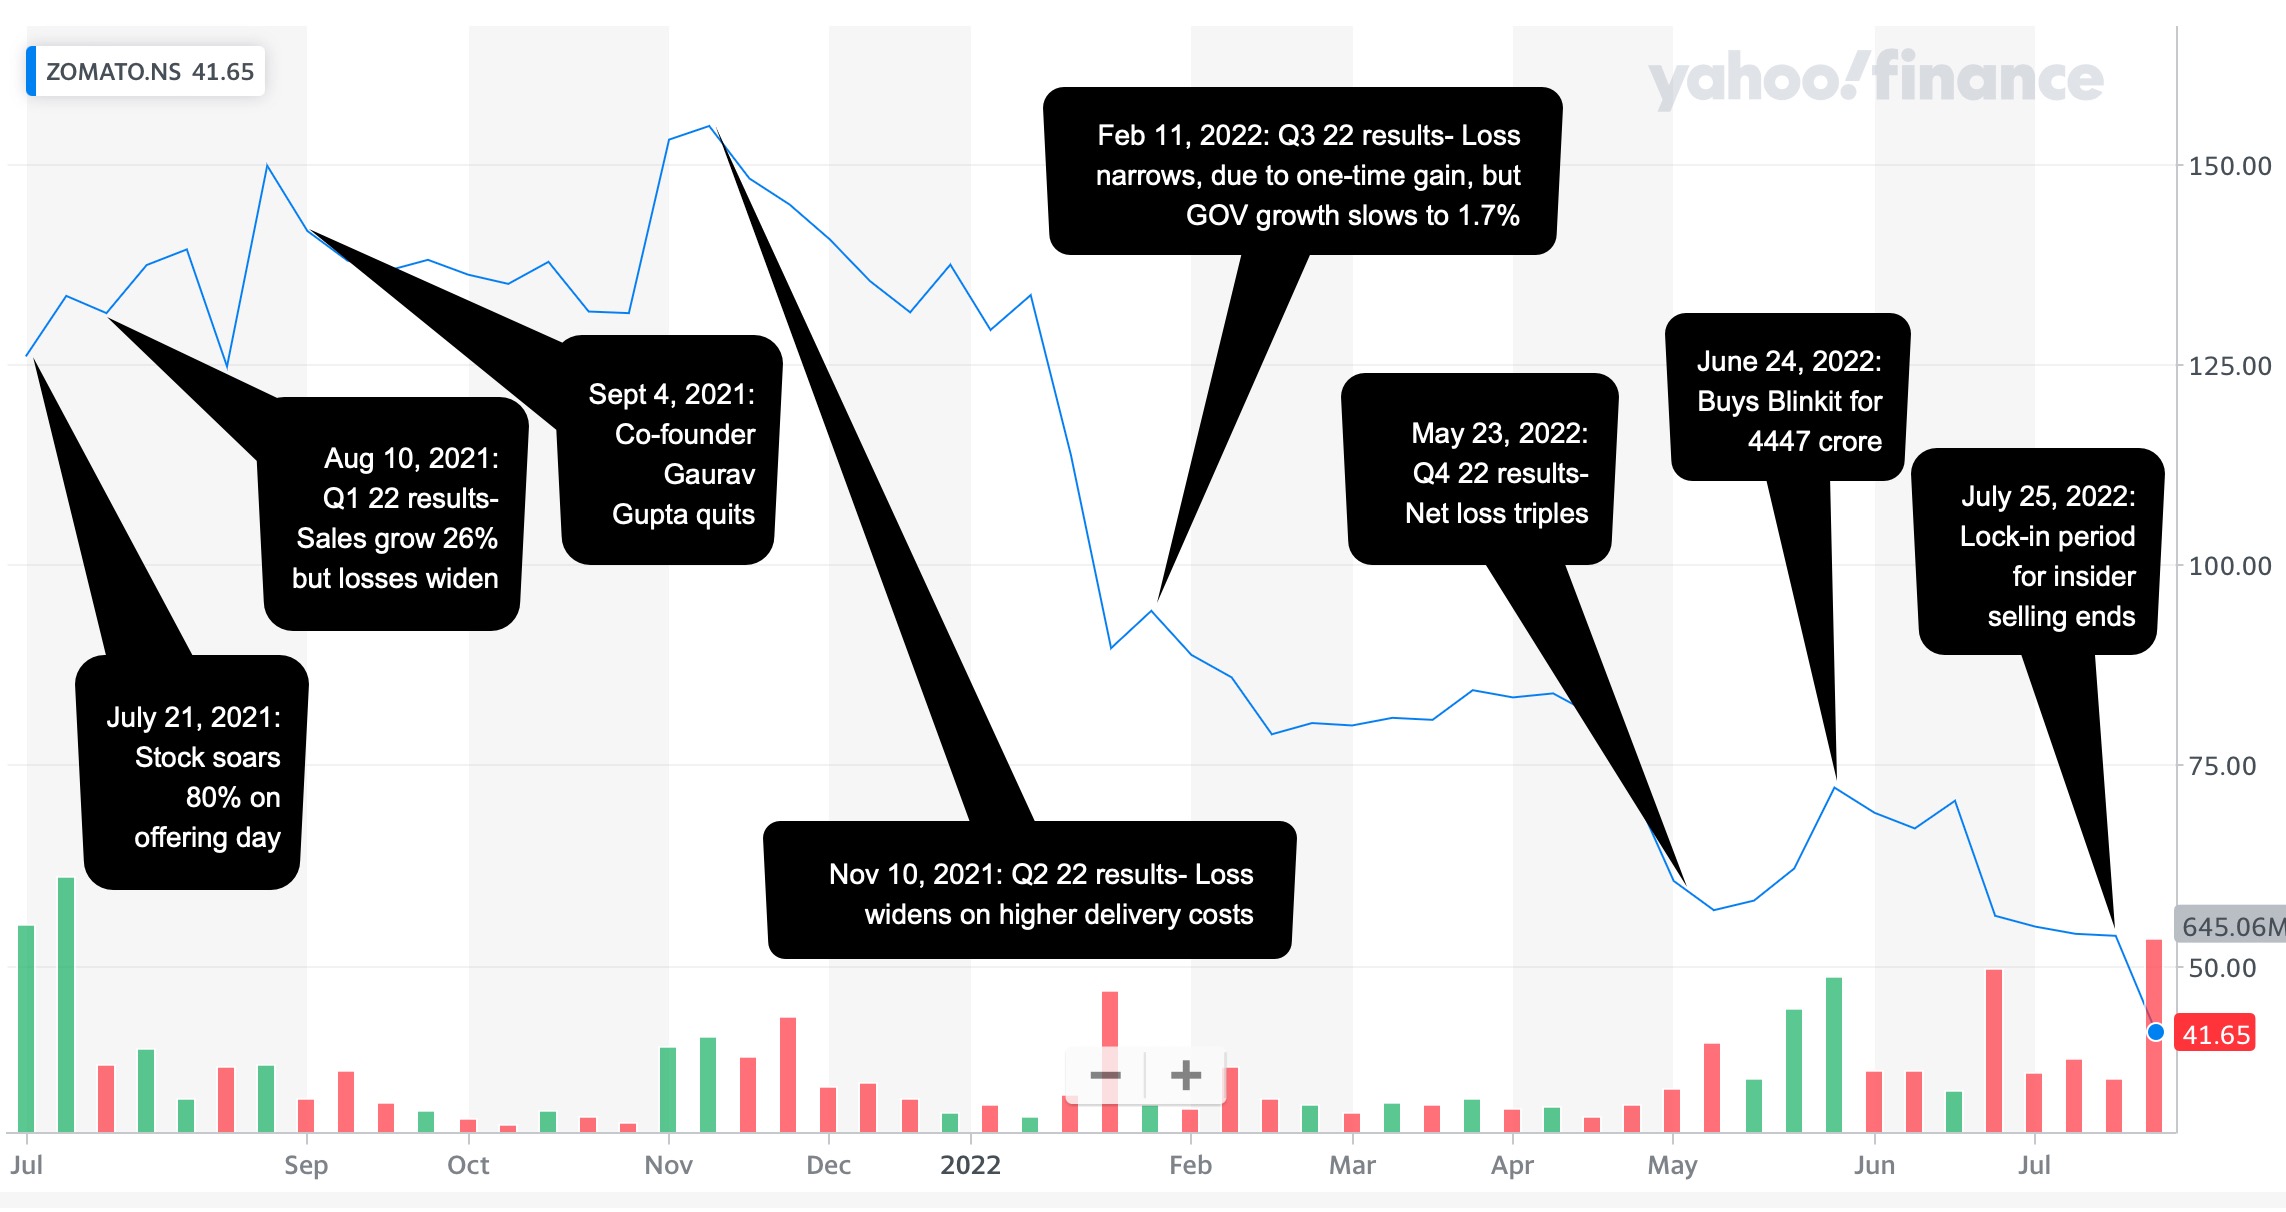
Zomato, an Indian online food delivery company, listed on July 14, 2021, at ₹115 per share, delivering a strong 53% listing gain and reaching ₹161 shortly after. However, by November 2021, market sentiment shifted, as valuation concerns surfaced given widening losses, weak macro factors, and bearish sentiment in the tech sector leading to a significant correction. The stock declined sharply, bottoming out at ₹41 in July 2022.
However, Zomato experienced an exceptional recovery, surging by 541% from its trough. The stock is currently trading at ₹263 as of September 9, 2024.
Reasons for Plunge in stock Price from ₹161 to ₹41
| The value drivers below for Food Delievery | Rs in cr |
| Indian food delivery market in 2024 | ₹ 56,533.00 |
| Indian food delivery market in 2030 | ₹ 2,01,739.00 |
| Growth rate in GOV years 6 years | 24.00% |
| Growth rate in Revenue years 6 years | 25.00% |
| Market Share for Zomato in 2024 | 57.00% |
| Expected market share | 60.00% |
| Revenues as percent of GOV 2030 | 24.00% |
| Operating Margin in 2030 | 30.00% |
| The value drivers for Blinkit | Rs in cr |
| Total Indian Quick Commerce 2024 | ₹ 27,000.00 |
| Total Indian Quick Commerce 2030 | ₹ 2,30,097.66 |
| Growth rate in GOV years 6 years | 43.00% |
| Growth rate in Revenue years 6 years | 52.00% |
| Market Share for Zomato in 2024 | 46.00% |
| Expected market share | 50.00% |
| Revenues as percent of GOV 2030 | 25.00% |
| Operating Margin in 2030 | 30.00% |
| FOOD DELIVERY(₹ in Cr | FY24 | FY25 | FY26 | FY27 | FY28 | FY29 | FY30 |
| Total Indian food delivery | ₹ 56,533.33 | ₹ 73,493.33 | ₹ 91,866.67 | ₹ 1,14,833.33 | ₹ 1,40,096.67 | ₹ 1,68,116.00 | ₹ 2,01,739.20 |
| Gross Order Value | ₹ 32,224.00 | ₹ 42,258.67 | ₹ 53,282.67 | ₹ 67,177.50 | ₹ 82,657.03 | ₹ 1,00,029.02 | ₹ 1,21,043.52 |
| Revenues | ₹ 7,792.00 | ₹ 10,142.08 | ₹ 12,787.84 | ₹ 16,122.60 | ₹ 19,837.69 | ₹ 24,006.96 | ₹ 29,050.44 |
| Operating Profit | ₹ 911.94 | ₹ 1,267.76 | ₹ 2,131.31 | ₹ 3,022.99 | ₹ 4,132.85 | ₹ 7,302.12 | ₹ 8,836.18 |
| Present value of FCFF | ₹ 427.38 | ₹ 847.16 | ₹ 1,211.68 | ₹ 1,573.59 | ₹ 2,782.10 | ₹ 42,105.08 | |
| BLINKIT (₹ in Cr) | FY24 | FY25 | FY26 | FY27 | FY28 | FY29 | FY30 |
| Total Indian Quick Commerce | ₹ 27,000.00 | ₹ 40,500.00 | ₹ 60,750.00 | ₹ 88,593.75 | ₹ 1,25,507.81 | ₹ 1,72,573.24 | ₹ 2,30,097.66 |
| Gross Order Value | ₹ 12,469.00 | ₹ 18,900.00 | ₹ 28,755.00 | ₹ 42,525.00 | ₹ 61,080.47 | ₹ 85,136.13 | ₹ 1,15,048.83 |
| Revenues | ₹ 2,301.00 | ₹ 3,693.97 | ₹ 5,933.84 | ₹ 9,239.36 | ₹ 13,937.29 | ₹ 20,355.16 | ₹ 28,762.21 |
| Operating Profit | -₹ 384.00 | ₹ 189.00 | ₹ 599.06 | ₹ 1,346.63 | ₹ 2,748.62 | ₹ 4,753.43 | ₹ 8,628.66 |
| Present value of FCFF | -₹ 183.55 | -₹ 87.68 | ₹ 129.98 | ₹ 711.72 | ₹ 1,300.43 | ₹ 42,203.91 |
| PV of cash flows during next 6 years = | ₹ 14,206 |
| PV of terminal value = | ₹ 78,816 |
| Value of operating assets | ₹ 93,022 |
| Adjusted value of operating assets | ₹ 93,022 |
| + Cash on hand | ₹ 12,241 |
| + Cross holdings in companies | ₹ 10,365 |
| Value of all assets | ₹ 1,15,628 |
| – Debt | ₹ 867 |
| Value of Equity | ₹ 1,14,761 |
| – Value of options outstanding | ₹ 3,800 |
| Number of shares outstanding | 868.78 |
| Value per share | ₹ 127.72 |
The estimated value of Zomato for its combined food delivery and Blinkit business is ₹127.72. Our estimates contain a mix of good and bad news.
On the positive side, the food delivery market in India is expected to continue growing at a healthy rate, and we anticipate that Zomato will maintain its market share. In fact, Zomato is projected to control 60% of the food delivery business and 50% of the quick commerce market.
We expect Zomato’s gross order value and revenues to grow at a compound annual growth rate (CAGR) of 43% and 52% respectively for quick commerce, and 24% and 25% respectively for the food delivery business.
Zomato should be able to expand its margins in line with the global industry average, which is around 30%.
On the negative side, despite expecting robust growth in market size and revenue for both businesses, it is unlikely that the total market cap will exceed ₹1,14,761 crore for both Blinkit and food delivery businesses.
Moving on to the other two businesses of Zomato, namely Hyper Pure and Going Out, the future trajectory of these businesses remains somewhat obscure. Despite this, we have tried our best to predict what the future may hold for both of these businesses.
| HYPER PURE | FY24 | FY25 | FY26 | FY27 | FY28 | FY29 | FY30 |
| Revenue | ₹ 3,172.00 | ₹ 4,758.00 | ₹ 6,899.00 | ₹ 9,659.00 | 12,073.75 | ₹ 14,488.50 | ₹ 17,386.20 |
| Operating Profit | -₹ 22.50 | ₹ 52.00 | ₹ 193.00 | ₹ 603.69 | ₹ 1,448.85 | ₹ 1,738.62 | |
| Present value of FCFF | -₹ 372.44 | -₹ 388.69 | -₹ 386.03 | -₹ 95.74 | ₹ 275.28 | ₹ 8,369.86 |
With an estimated ₹7402 cr in Cashflows from HyperPure Business the cumulative value per share comes out to be ₹136.20
| GOING OUT | FY24 | FY25 | FY26 | FY27 | FY28 | FY29 | FY30 |
| Revenue | ₹ 258.00 | ₹ 361.20 | ₹ 505.68 | ₹ 707.95 | ₹ 920.34 | ₹ 1,196.44 | ₹ 1,555.37 |
Zomato’s “Going Out” segment has the potential to evolve into a high-margin classifieds business at scale. However, it is currently in a transitional phase and incurring losses.
