
|
THE SNAPSHOT-Innova Captab |
|||
|
CMP |
₹752 | Market Cap | ₹4,304 Cr |
|
P/E (TTM) |
32x | Book Value |
₹178 |
| ROE / ROCE | 14.3% / 14.6% | 52W H/L |
₹1,021 / ₹608 |
| 5Y Sales CAGR | 27% | 5Y PAT CAGR |
36% |
Stock has corrected ~26% from 52W high while earnings power is still building – that gap is what this thesis explores.
Innova Captab is a contract manufacturer for the Indian pharma industry. It makes the actual pills, syrups, and injections that Cipla, Lupin, Mankind, Glenmark, JB Chemicals, Ajanta – and 14 of India’s top 15 branded pharma firms – sell under their labels. It also has a smaller, fast-growing branded business of its own (domestic + exports). Think of it as the picks-and-shovels of Indian pharma.
Two things matter right now: (1) a brand-new ₹480 Cr greenfield plant in Jammu just started commercial production (Jan 2025) and is ramping; (2) the branded generics arm has stepped – up 79% YoY in the latest quarter.
Pre-Jammu, the company ran asset turns of ~5-6x – unusual for manufacturing. This is what historically delivered ROCE of 25-30% (FY20-FY22). The Jammu capex temporarily depressed this. The dilution of ROCE is from the Jammu ramp-up.
The thesis is that this is a textbook J-curve: near-term margin and ROCE pain, multi-year earnings step-up.
Bottom Line
Innova Captab is a quietly compounding, well-managed CDMO with a 5-year track record of doubling revenue. Today’s price reflects the cost of growth (Jammu capex, working-capital intensity) but not yet the value of growth (peak ₹1,400+ Cr from one plant, branded generics on a ~50% growth run-rate, Schedule-M consolidation tailwind, regulated-market entry).
Two KPIs to track: (1) Jammu quarterly revenue (₹89 Cr in Q3 FY26 – needs to keep climbing); (2) cash conversion cycle (101 days in FY25 – needs to mean-revert). If both move the right way for two more quarters, the thesis is intact.
Valuation & Investment Framework
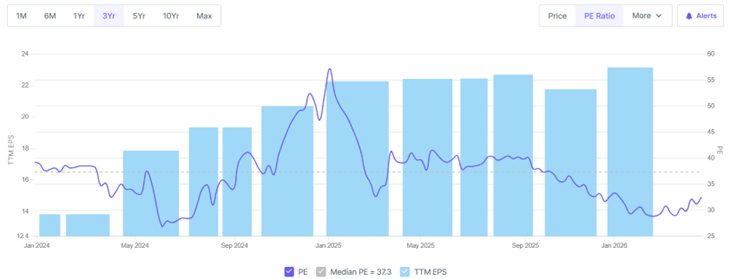
At ₹752, market cap ₹4,304 Cr, 32.5x trailing P/E. The stock is down ~26% from its 52W high and is below its IPO premium-listing zone. The compression is what creates the opportunity – fundamentals (revenue +27%, PAT inflecting in Q3 FY26) are improving while the multiple has come down.
Three-Scenario Framework (FY28 lens)
|
Scenario |
What needs to happen | FY28E PAT | Target Multiple | Implied Upside |
| Bull | Jammu hits ₹700-900 Cr by FY28; Branded Generics sustains 30%+; margins reach 18% | ₹260 Cr | 30x |
~80% to ₹1,290 |
| Base | 20% revenue CAGR (mgmt guide); EBITDA margin 16-17%; Jammu at ₹500-700 Cr | ₹200 Cr | 25x |
~16% to ₹875 |
| Bear | Jammu stalls below 35% utilisation; WC bloat continues; margins flat at 14% | ₹140 Cr | 18x |
−40% to ₹440 |
What Does Innova Actually Do?
Three businesses under one roof, but most people only need to understand two:
1. CDMO – the engine (~69% of revenue)
Big pharma companies design and brand drugs but increasingly outsource the boring, capital-heavy job of actually manufacturing them. Innova is the outsourced factory. It makes tablets, capsules, oral solids, oral liquids, dry syrups, dry powder injectables, parenteral and ointments across roughly 3,700+ products spanning antibiotics, painkillers, anti-diabetics, cardio, gastro, etc.
Why customers stay sticky: Innova has relationship with 300+ CDMO customer with contracts run 2-5 years, regulatory re-qualification of a new vendor takes 12-18 months, and a single big customer typically routes 200-300 SKUs through a handful of trusted manufacturers. Switching is painful, slow, and risky – which is exactly what gives Innova its predictable cash flows.
2. Branded Generics – the optionality (~31% and rising)
Innova also sells its own branded products in India (via distributors and pharmacies) and exports them to ~60+ countries (LATAM, Africa, CIS, SE Asia). This business carries higher margins than pure CDMO, and it grew 79% YoY in Q3 FY26 and 56% in 9MFY26 – a real acceleration, not a one-off.
The Industry: A Tailwind Big Enough to Notice
Two structural shifts make CDMOs in India a multi-year story:
- Outsourcing wave: Large branded pharma firms increasingly want to be marketing-and-R&D companies, not factory operators. Capex is routed to CDMOs.
- Schedule M (revised, 2024): India’s new manufacturing quality norms now mirror international GMP. Smaller, sub-scale, non-compliant manufacturers are being squeezed out. This is consolidation by regulation – and the largest, most compliant CDMOs (Innova is in the top 3 by revenue) are the natural beneficiaries.
- China+1 / BIOSECURE: Global pharma is de-risking China exposure. Indian CDMOs are the first call. The Indian CDMO market is sized at ~$8-25 billion (estimates vary by scope) and growing at ~10-13% CAGR through 2030.
Competitive Position & Moats
Innova is the 2nd largest formulation CDMO in India by revenue, behind only Akums.
Its moats are quiet but real:
- Customer entrenchment: 14 of India’s top 15 branded pharma firms are clients. Once a vendor is qualified for an SKU, they typically stay for life of the product.
- Scale + dosage form breadth: Most rivals do tablets-and-capsules. Innova does tablets, capsules, dry syrups, dry-powder injectables, ointments, liquid orals, and complex forms (sustained-release, tablet-in-capsule). Wider menu = larger share of customer wallet.
- Cephalosporin block: A separate, dedicated antibiotic plant – these are regulatorily isolated and capital-intensive to build. Recently received UK MHRA approval (Aug 2025), opening regulated export markets.
- Asset-light economics: Pre-Jammu, the company ran asset turns of ~5-6x – unusual for manufacturing. This is what historically delivered ROCE of 25-30% (FY20-FY22). The Jammu capex temporarily depressed this.
Growth Drivers – The Next 3 Years
Driver #1: The Jammu Plant Ramp
This is the single biggest variable in the thesis.
- Investment: ~₹480 Cr greenfield (~240,000 sq ft) in Kathua, Jammu.
- Commercial production started Jan 14, 2025.
- Q2 FY26 contribution: ₹60 Cr Q3 FY26: ₹89 Cr trajectory is steep.
- Peak revenue at ~65-75% utilisation: ₹1,400+ Cr (management). Once steady-state, Jammu alone could be larger than the entire company was in FY24.
- Currently EBITDA-breakeven; PAT positive expected in coming quarters as fixed costs absorb.
- Caveat: the Sept-2025 GST cut on pharma (12%→5%) reduced the tax-arbitrage incentive Jammu was originally designed to capture. Management says the impact is short-term and will neutralise as volumes ramp.
Driver #2: Branded Generics on Fire
This segment grew 79% YoY in Q3 FY26 (₹152 Cr) and 56% in 9MFY26 (₹368 Cr). Domestic plus international branded combined is now scaling toward a ₹600 Cr run-rate. Higher gross margin than CDMO, and it gives Innova pricing power rather than just contract economics.
Driver #3: Margin Mix Shift
Management’s stated long-term EBITDA margin band is 17-19% vs. ~15% currently. The path: (a) Jammu utilisation, (b) branded generics share rising, (c) higher-value forms (BFS, large-volume parenterals, respiratory) coming online at Jammu, (d) regulated exports kicking in post UK MHRA approval.
Driver #4: Regulated Markets Open Up
Jammu blocks have received PIC/S certification (via Ukraine SMDC). Cephalosporin Baddi has UK MHRA clearance. These unlock semi-regulated and regulated export markets where pricing is structurally higher.
The Numbers – Past, Present, and Direction
Annual Performance (Consolidated, ₹ Cr)
|
|
FY21 | FY22 | FY23 | FY24 | FY25 |
TTM* |
| Revenue | 411 | 801 | 926 | 1,081 | 1,244 |
1,497 |
| EBITDA | 54 | 96 | 114 | 154 | 186 |
221 |
|
EBITDA % |
13% | 12% | 12% | 14% | 15% | 15% |
|
PAT |
34 | 64 | 68 | 94 | 128 |
132 |
|
ROCE % |
28% | 31% | 24% | 19% | 15% | – |
Revenue almost 4x’d in 5 years (FY20→FY25) and PAT nearly 5x’d. EBITDA margins are slowly walking up from 12% to 15%. ROCE has compressed from 31% (FY22 peak) to ~15% – this is the Jammu capex sitting on the balance sheet but not yet earning. That ratio normalising back toward 22%+ is the underappreciated upside.
9MFY25 vs. 9MFY26 – The Ramp Becomes Visible
| 9M FY25 | 9M FY26 | Growth | |
| Revenue (₹ Cr) | 928 | 1,182 | +27.3% |
| CDMO Revenue | ~690 | 814 | +18% |
| Branded Generics | ~236 | 368 | +56% |
| EBITDA (₹ Cr) | 147 | 184 | +24.8% |
| PAT (₹ Cr) | 98 | 103 | +5% |
| Jammu contribution | nil | ~₹170 Cr | new |
| Exports % of mix | ~28% | 32% | +4 pp |
Revenue grew 27% but PAT grew only 5%. That gap is exactly the Jammu drag – fixed costs, depreciation, and interest hitting the P&L before the plant earns at scale. As Jammu utilisation rises from low double-digits today (FY26, management expectation for Jammu is ₹270–280 cr, possibly slightly higher) toward 65%+, that gap should close violently in PAT’s favour. Q3 FY26 alone – PAT up +44% YoY – is the early signal.
Risks – The Other Side of the Trade
- Jammu under-utilisation: If utilisation stays at 30-40% for longer than expected, depreciation and interest will keep dragging PAT. The thesis breaks if Jammu doesn’t scale.
- Working-capital expansion: Cash conversion cycle widened from 75 days (FY24) to 101 days (FY25). Inventory days jumped from 91 to 119. Free cash flow has been negative for 3 years (FY23, FY24, FY25).
- Customer concentration: Top customers contribute a meaningful share of CDMO revenue. Loss of any one would hurt – though the 14-of-15 client mix actually diversifies risk relative to single-client CDMOs.
- API price volatility: CDMO contracts often have pass-through structures, but year-on-year API price declines have nipped reported revenue growth in the past. Pricing has now stabilised, per management.
- GST cut on pharma (12%→5%): Diluted Jammu’s tax-arbitrage advantage. Management sees 2-3 quarters of impact before normalising.
- Promoter pledge: Recent disclosures (Mar 2026) show ~6.4% of shares pledged with Vistra ITCL. Worth tracking – small now, but a creep here is a red flag in any Indian small/midcap.
