|
THE SNAPSHOT- Rashi Peripherals |
|||
| CMP | ₹518 | Market Cap |
₹3,414 Cr |
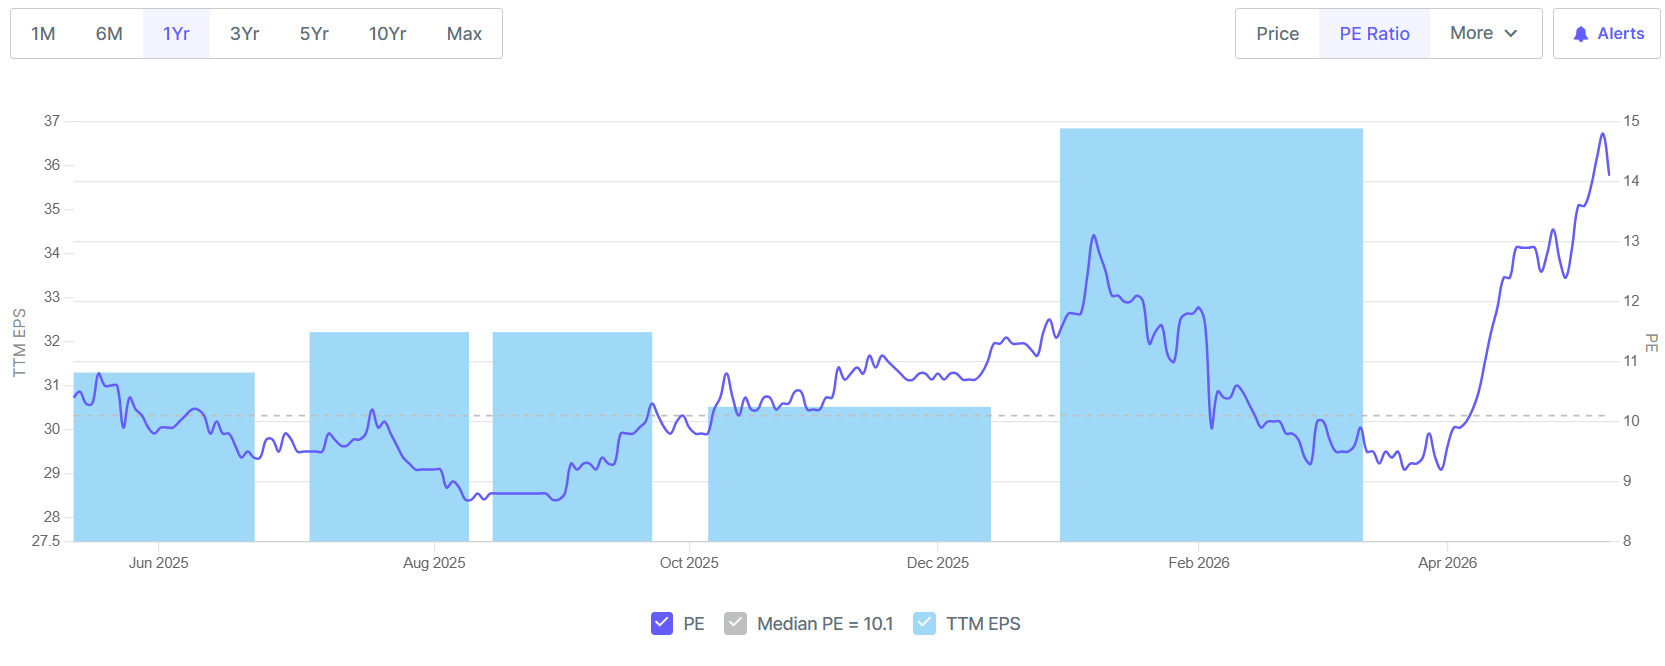
| P/E (TTM) | 14x | P/B |
1.84x |
| Revenue (TTM) | ₹14,311 Cr | PAT (TTM) |
₹248 Cr |
| ROE / ROCE | 12.5% / 14.2% | 52W H/L |
₹547 / ₹275 |
|
5Y Sales CAGR |
28.5% | 5Y PAT CAGR |
39.4% |
|
Promoter holding |
64.0% | Net Debt/Equity |
0.5x |
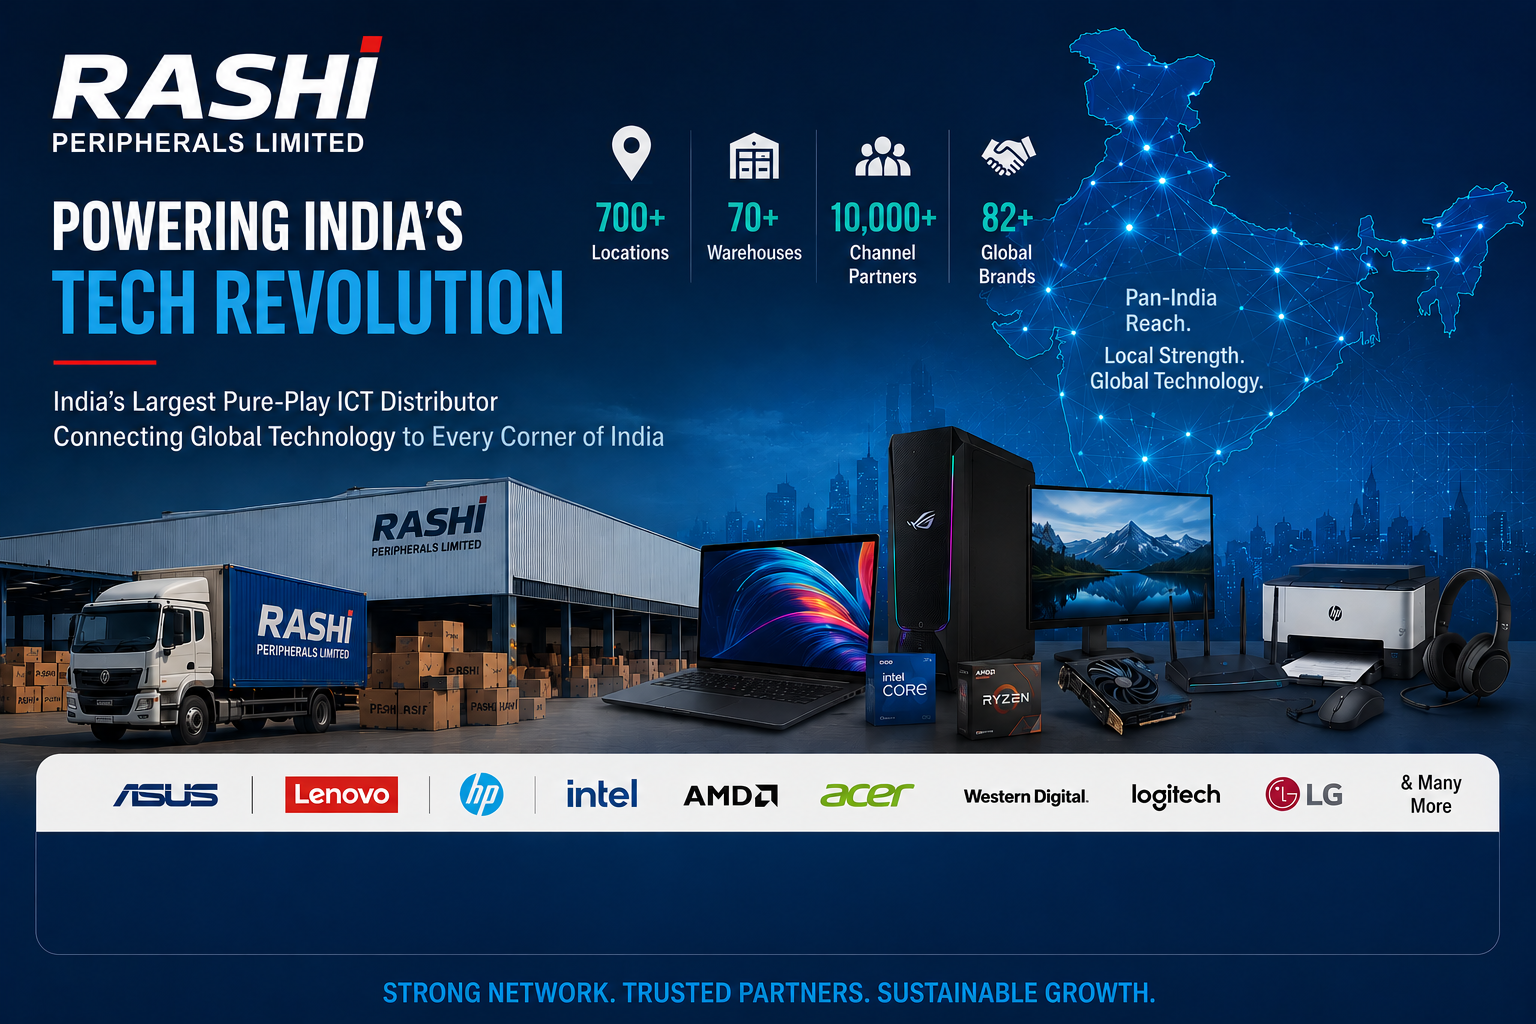
Rashi Peripherals (RP Tech) is the largest pure-play ICT (Information & Communication Technology) distributor in India.
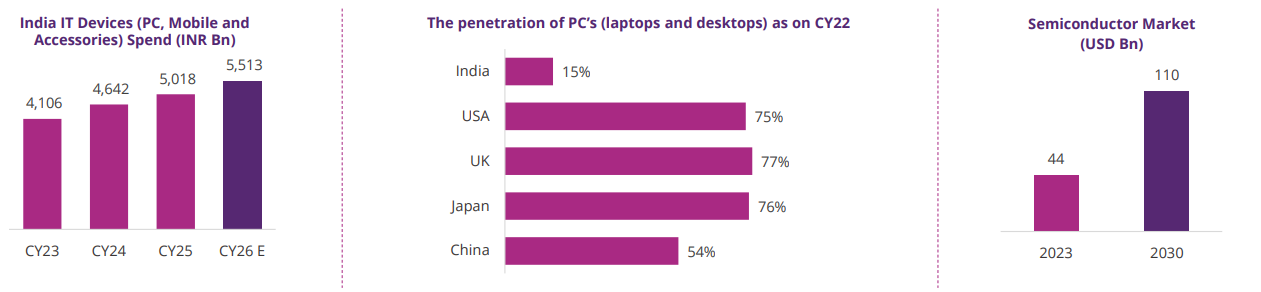
- India’s IT devices spend is on a steady upcycle, driven by enterprise hardware refresh, digital infrastructure build-out, and rising non-metro adoption.
- Sustained growth in devices spend provides a durable volume runway for ICT distributors, as demand spans PCs, peripherals, storage, networking, and enterprise hardware, supporting scale-led growth.
- PC penetration in India remains structurally underpenetrated, with installed base and household penetration significantly below developed markets, leaving a large headroom for growth as digital adoption deepens across education, enterprises, and MSMEs. The penetration of PC’s (laptops and desktops) in India is low with growth expected to be at 12-15% in FY24-27E.
- India’s semiconductor opportunity is structurally large and scaling fast, with the domestic electronics market exceeding USD 150 bn and semiconductor consumption projected to cross USD 80-100 bn by the end of the decade, driven by automotive, mobility, data centres, and industrial electronics.
Why Invest
- Multi-year tech infrastructure tailwind. AI laptops, Windows 12, data-centres, semiconductor distribution, government digitisation – all distributor-friendly.
- Operating leverage kicking in. EBITDA margin walked from 2.6% (FY25) to 2.95% (Q3 FY26). Each 50 bps = ~₹70 Cr extra PAT.
- Balance sheet is now clean. Post-IPO ₹326 Cr debt repaid; D/E at 0.5x; CARE upgrade to AA; positive operating cash flow in 9MFY26.
- The valuation is structurally cheap- 13x P/E for a market leader in a re-rating cycle is the kind of mispricing you only see when the market hasn’t yet noticed the inflection.
Valuation Framework
At ₹518, market cap ₹3,414 Cr, ~14x TTM P/E. On forward FY27 earnings, that’s 8-9x – distributor multiples for what is increasingly a tech-infrastructure enabler. P/B of 1.8x means there’s not much downside on book value.
The Business Model – Distribution at Scale
When Indian businesses, governments, and consumers buy laptops, processors, RAM, SSDs, monitors, networking gear, or printers from ASUS, Lenovo, HP, Intel, AMD, Acer, LG, Western Digital, Logitech – roughly half the time, the box passed through Rashi’s warehouse before reaching the buyer.
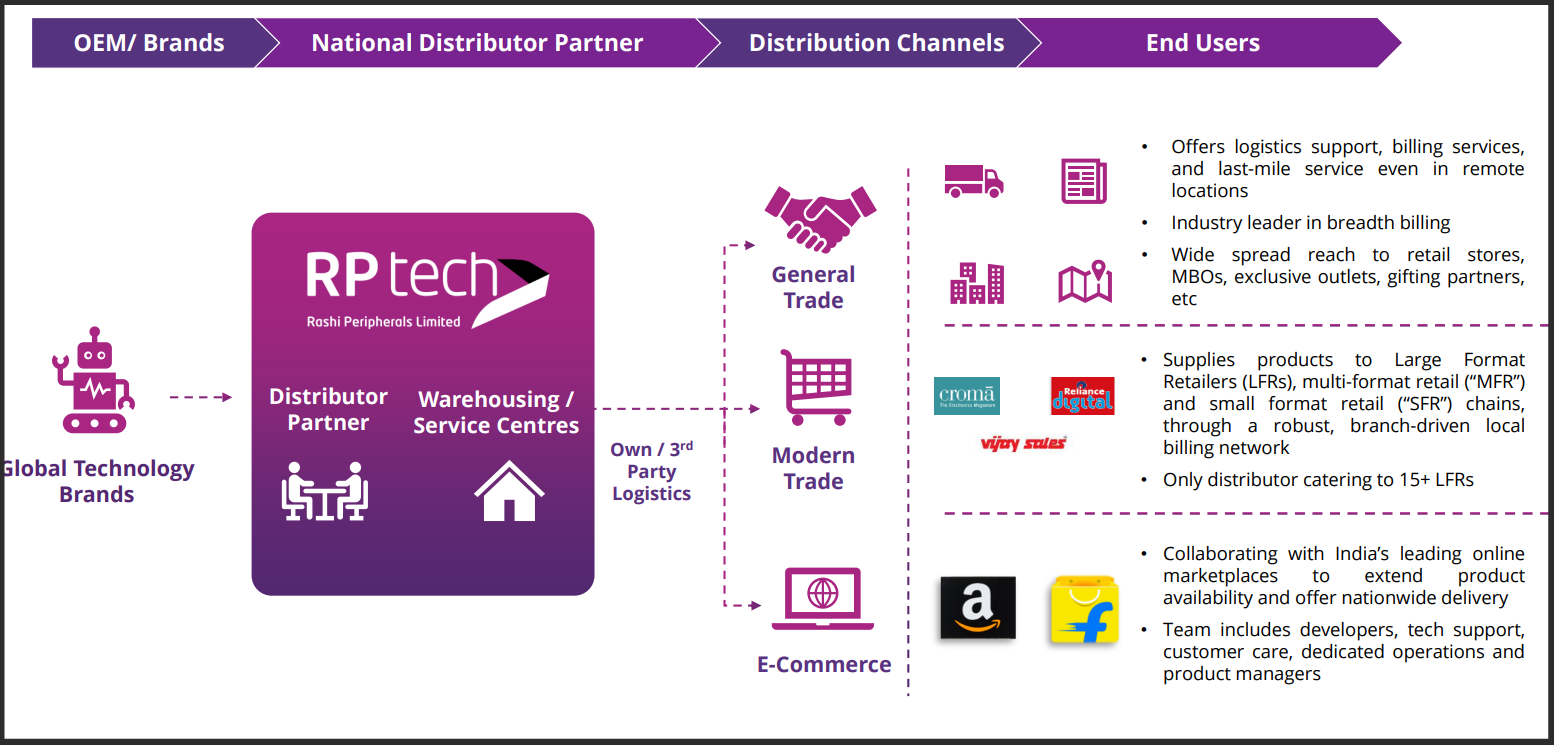
Rashi sits between 82 global technology brands (the OEMs) and 10,000+ Indian channel partners (the small resellers, system integrators, and MSME-focused dealers). One of India’s largest ICT distribution networks with 700+ locations, 55 branches, 70 warehouses and 50 service centres, extending technology reach beyond metros into Tier-2, Tier-3 and emerging markets
It buys in bulk, holds inventory, distributes pan-India, finances credit, and provides after-sales service.
Two Reporting Verticals
- PES – Personal Computing, Enterprise & Cloud Solutions (~58% of revenue, 9MFY26): PCs, notebooks, CPUs, motherboards, GPUs, servers, storage, networking, embedded systems, data-center components. The fast-growing, higher-mix segment.
- LIT – Lifestyle and IT Essentials (~42%): Keyboards, mice, monitors, printers, accessories, lifestyle peripherals (smartwatches, fitness bands, gaming gear). Lower-margin volume play but deep channel reach.
How It Actually Makes Money
Distribution is a thin-margin, high-velocity game. Rashi’s gross margin is ~5%, EBITDA margin ~3%, PAT margin ~1.7%. Sounds low, but the model is asset turns + capital efficiency: rotate inventory 6-7 times per year, collect from partners in ~45 days, pay vendors in ~40 days, and the working capital does the heavy lifting.
Operational Footprint
- Reach: One of India’s largest ICT distribution networks with 700+ locations, 55 branches, 70 warehouses and 50 service centres, extending technology reach beyond metros into Tier-2, Tier-3 and emerging markets
- Customer base: 10000+ active customers across 680+ locations, including resellers, system integrators, BFSI, government, education, data centres.
Industry Structure: Why Rashi Wins When India Buys Tech
The Indian ICT Distribution Landscape
It’s an oligopoly – three or four large national distributors handle the lion’s share of pan-India ICT distribution. Brands won’t fragment: managing 100 small distributors is operationally impossible, while a top distributor offers credit-backed reach, channel financing, and warehousing scale. Once an OEM signs you, switching cost is enormous.
Growth Drivers
The Moats – Why Rashi Doesn’t Lose Customers
- Brand exclusivity / preferential status: ASUS’s #1 distributor in India (~20% of Rashi PC sales). Lenovo’s #1 commercial partner. HP’s #3 overall. 90% of ASUS gaming laptops in India flow through Rashi. These are the anchor relationships competitors can’t replicate without years of trust-building.
- Channel ecosystem: 10,000+ partners across +700 locations. Rashi runs 100+ partner training events annually. Migrating partners to a competitor is operationally and commercially expensive – they’d lose existing credit lines, training, and incentives.
- Credit/working-capital muscle: Rashi extends 45-55 days credit to partners, financed by lower vendor terms and bank lines. Smaller distributors can’t match this – and credit IS the product for many MSME resellers. A recent CARE upgrade to AA further reduces borrowing cost.
- Pan-India warehousing: 68 warehouses + service centres mean tier-2/3 partners get next-day delivery. New entrants would need crores of capex just to match this physical presence.
- Promoter pedigree: Founders Krishna Kumar Choudhary and Suresh Pansari built this from scratch since 1989. 22.7% revenue CAGR over 20 years. Operationally seasoned, conservative.
Growth Triggers –
Trigger #1: PC Replacement + AI Laptop Cycle
PCs sold during 2020-21 (pandemic boom) are now 4-5 years old. The replacement cycle has begun. AI-PC penetration adds another wave: every laptop with an NPU (Neural Processing Unit) is a higher-ASP sale. India PC shipments grew >10% YoY recently. Rashi has 10% market share – management aims for 15%+.
Trigger #2: Enterprise + Data Centre Deals
Enterprise/data-centre revenue jumped from ₹100 Cr (FY24) → ₹2,000 Cr (H1 FY25). Includes Yotta NMDC AI data centre (₹1,510 Cr), Tamil Nadu government education project (₹300 Cr), and Reliance work. Management target: ₹3,000-5,000 Cr by FY27
Trigger #3: Embedded Systems & Semiconductors
This vertical does small-chip distribution to manufacturing units (auto sector, IoT, industrial). FY24 revenue ₹70 Cr → FY25 ~₹100 Cr → FY27 target: ₹800-1,000 Cr. Higher gross margins (5-7% vs. 5% blended). New embedded application lab in Bengaluru (May 2024) is the platform.
Trigger #4: Quick Commerce
New verticals being incubated. Quick commerce opens a high-velocity channel. That is selling tech products through 10-minute delivery apps (Blinkit, Zepto, Instamart). Inventory turns 20–25x per year here vs. 6–7x in traditional channel
Trigger #5: Dell Partnership (Q4 FY26 onwards)
Recently announced. Dell is one of the largest enterprise/commercial PC players in India. Adding their distribution mandate in Q4 FY26 is a meaningful new revenue stream that hasn’t yet shown up in numbers.
Annual Performance (Consolidated, ₹ Cr)
| FY21 | FY22 | FY23 | FY24 | FY25 | TTM* | |
| Revenue | 5,856 | 9,454 | 9,455 | 11,095 | 13,773 | 14,311 |
| YoY % | – | +61% | +0% | +17% | +24% | +10% |
| EBITDA | 190 | 303 | 305 | 307 | 361 | – |
| EBITDA % | 3.2% | 3.2% | 3.2% | 2.8% | 2.6% | – |
| PAT | 80 | 139 | 100 | 144 | 210 | 248 |
| EPS (₹) | – | – | – | – | 31.7 | 37.4 |
| ROE % | 39.7% | 33.9% | 21% | 20.8% | 13.3% | 12.5% |
| ROCE % | – | – | – | 16.2% | 14.5% | 14.2% |
ROE looks lower since IPO because the equity base expanded ~50% with fresh issue. Both metrics are structurally about to reverse: Q3 FY26 EBITDA margin already hit 2.95%; ROE on an incremental-capital basis is back above 20%.
9MFY25 vs. 9MFY26 – The Inflection Quarter (Q3 FY26)
| 9M FY25 | 9M FY26 | YoY | |
| Revenue (₹ Cr) | 10,800 | 11,338 | +5% |
| EBITDA (₹ Cr) | 265 | 315 | +19% |
| PAT (₹ Cr) | 157 | 196 | +25% |
| Q3 FY26 alone: | Q3 FY25 | Q3 FY26 | YoY |
| Revenue | 2,826 | 4,030 | +43% |
| EBITDA | 21 | 119 | +453% |
| EBITDA margin | 0.76% | 2.95% | +219 bps |
| PAT | 32 | 75 | +132% |
9M revenue is up only 5% – because Q1 and Q2 FY26 were softer. But Q3 FY26 alone showed +43% revenue and +132% PAT. Importantly, 9M PAT is still up +25% YoY with 9M EBITDA margin at 2.78% (vs. 2.45% in 9MFY25). Operating cash flow turned positive (+₹34 Cr in 9MFY26 vs. negative in FY25).
